|
DECARBONIZING THE UK ECONOMY by 2050 ABOUT - A-Z INDEX - CONTACTS - FOUNDATION - HOME - REGISTER
BUILDING RESILIENT SOCIETIES - You can almost watch the sea levels rising with the polar ice melt at its present rate, it is happening so quickly. Unlike our reaction time to making the reduction in carbon output to brake the effect that human industry and population growth is having on planet earth.
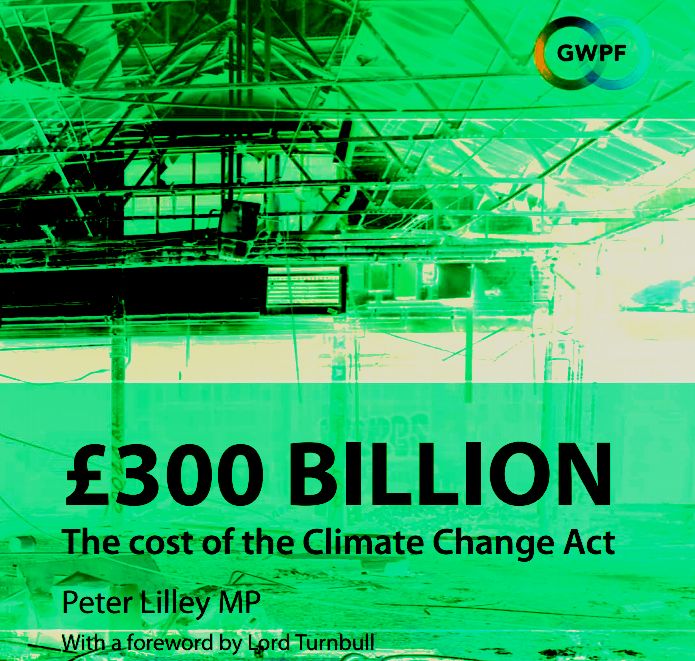
Our gut reaction is that it is not going to happen. Be grateful though that at least we have a legally binding target that we should be aiming for, embodied in the Climate Change Act 2008. That this is statute in the UK does not mean that the targets will be reached, but it does mean that if the parties do not play their part, they may be in for it. Success requires constant reminders from organizations like us to local authorities about this duty, where they are more interested in generating an income for their district from council taxes - with a "larger the better" attitude to fuel energy guzzling houses - for higher valuations - hence income to their coffers.
The Cleaner Ocean Foundation has been keeping tabs on fuel oil and gas deliveries on our doorstep, with alarming revelations as to the vast sums being spent on heating oils for period Victorian houses in the vicinity, not one of which has any energy harvesting technology incorporated. COF is keeping tabs on house building applications in East Sussex and can reveal that developers are not being asked for micro generation inclusion as per the Climate Change and Sustainable Energy Act 2006. That is house building. What about transport?
It's pretty much the same. The heart of any smart town or city is the infrastructure for transport. The transport medium exists in that electric vehicles are gaining in popularity, but the infrastructure for would be clean drivers is pathetically weak. What is required is a strong heart in the form of energy storage and bulk transfers for transport along the lines of Better Place, and now Tesla's version - but even better, the Bluebird™ energy transfer system for city refueling stations for EVs could provide a long-term solution - but only if a universal format for energy-cartridges can be defined for motor manufacturers to work towards. This would be a positive CCA move, if only funding were available for such a challenging social endeavour. It is not!
POPULATION GROWTH = MORE CARBON
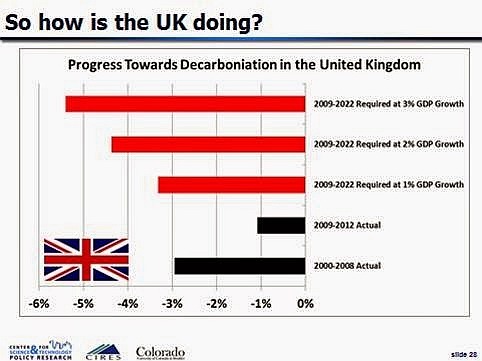
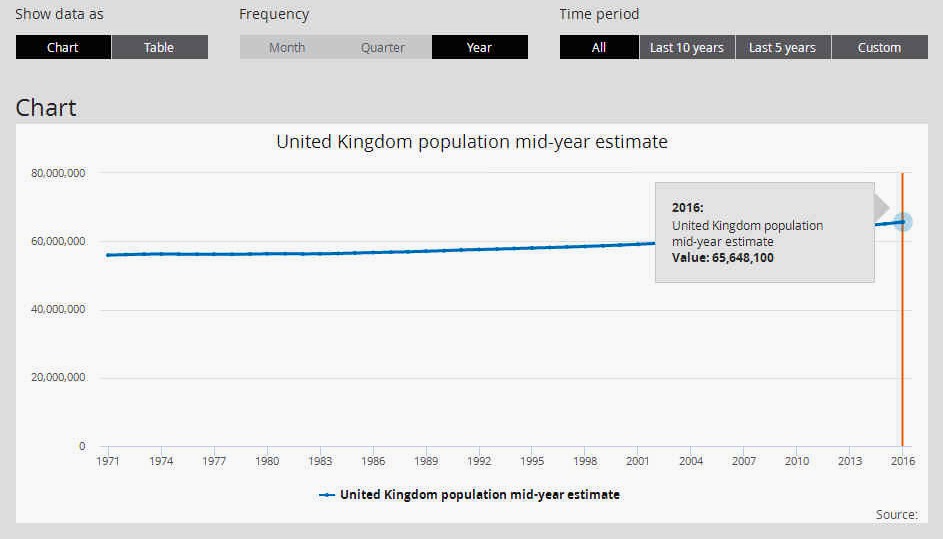
In 2006 UK carbon dioxide emissions (as accounted for under the rules of the Kyoto Protocol) were about 9 t/person. If a 2050 population of 82 million had per capita emissions of 9 t, then total UK emissions would be about 750 Mt of carbon dioxide, far above the 80% reduction goal of 119 Mt. A 2022 population of 67 million at 9 t of carbon dioxide per person would result in about 603 Mt of carbon dioxide, well above the 2022 target of 391 Mt. So a growing population means that the UK will have to reduce per capita emissions by as much as 85% in 2050, and by 35% in 2022, from 1990 levels.
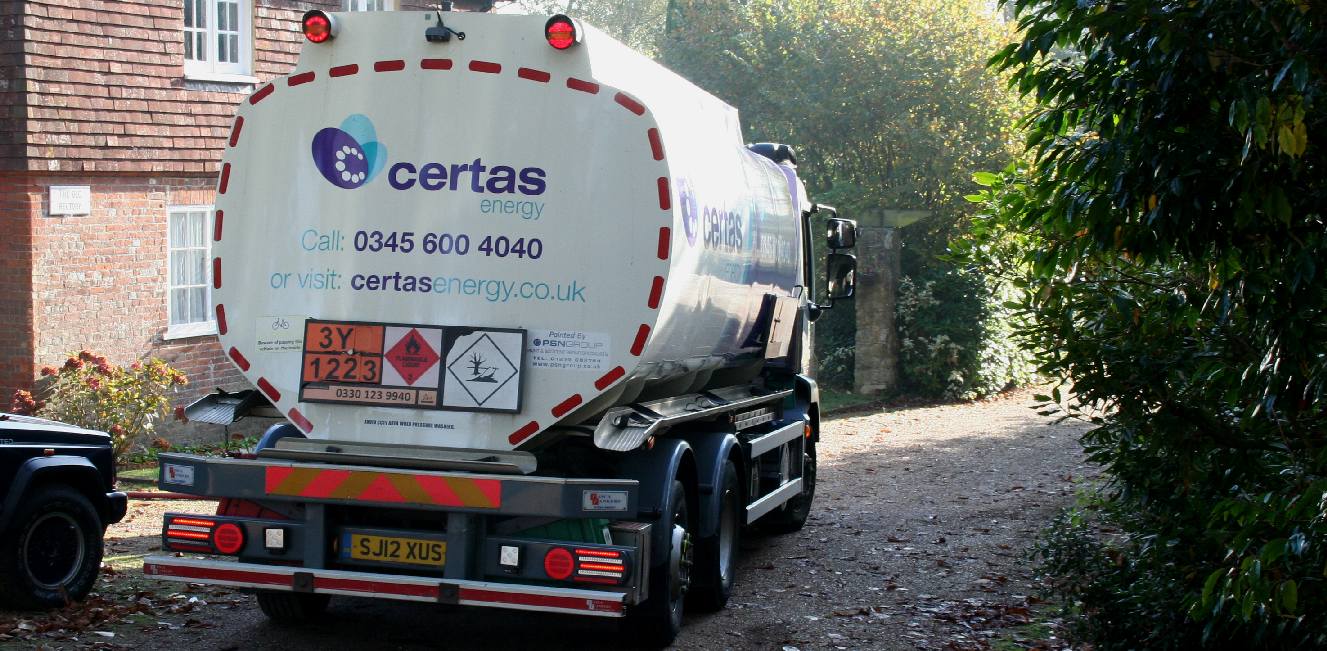
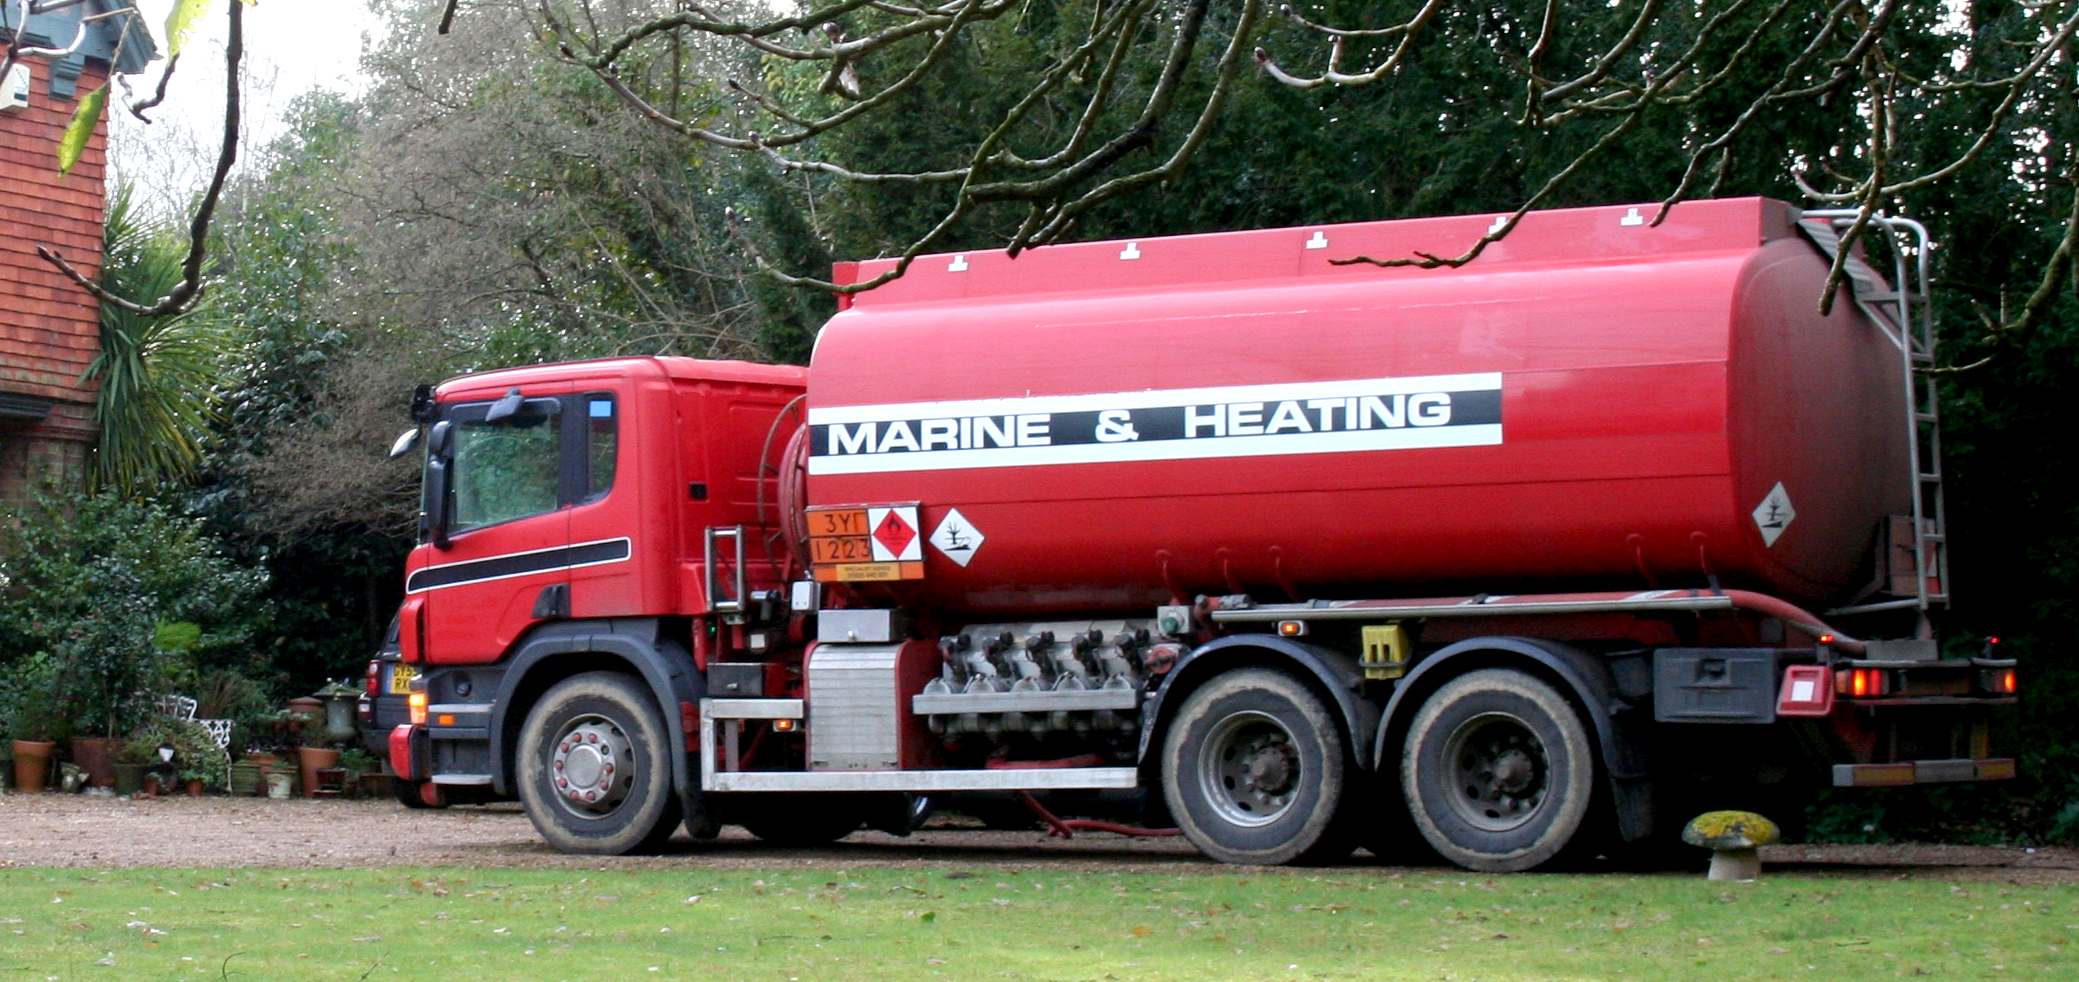
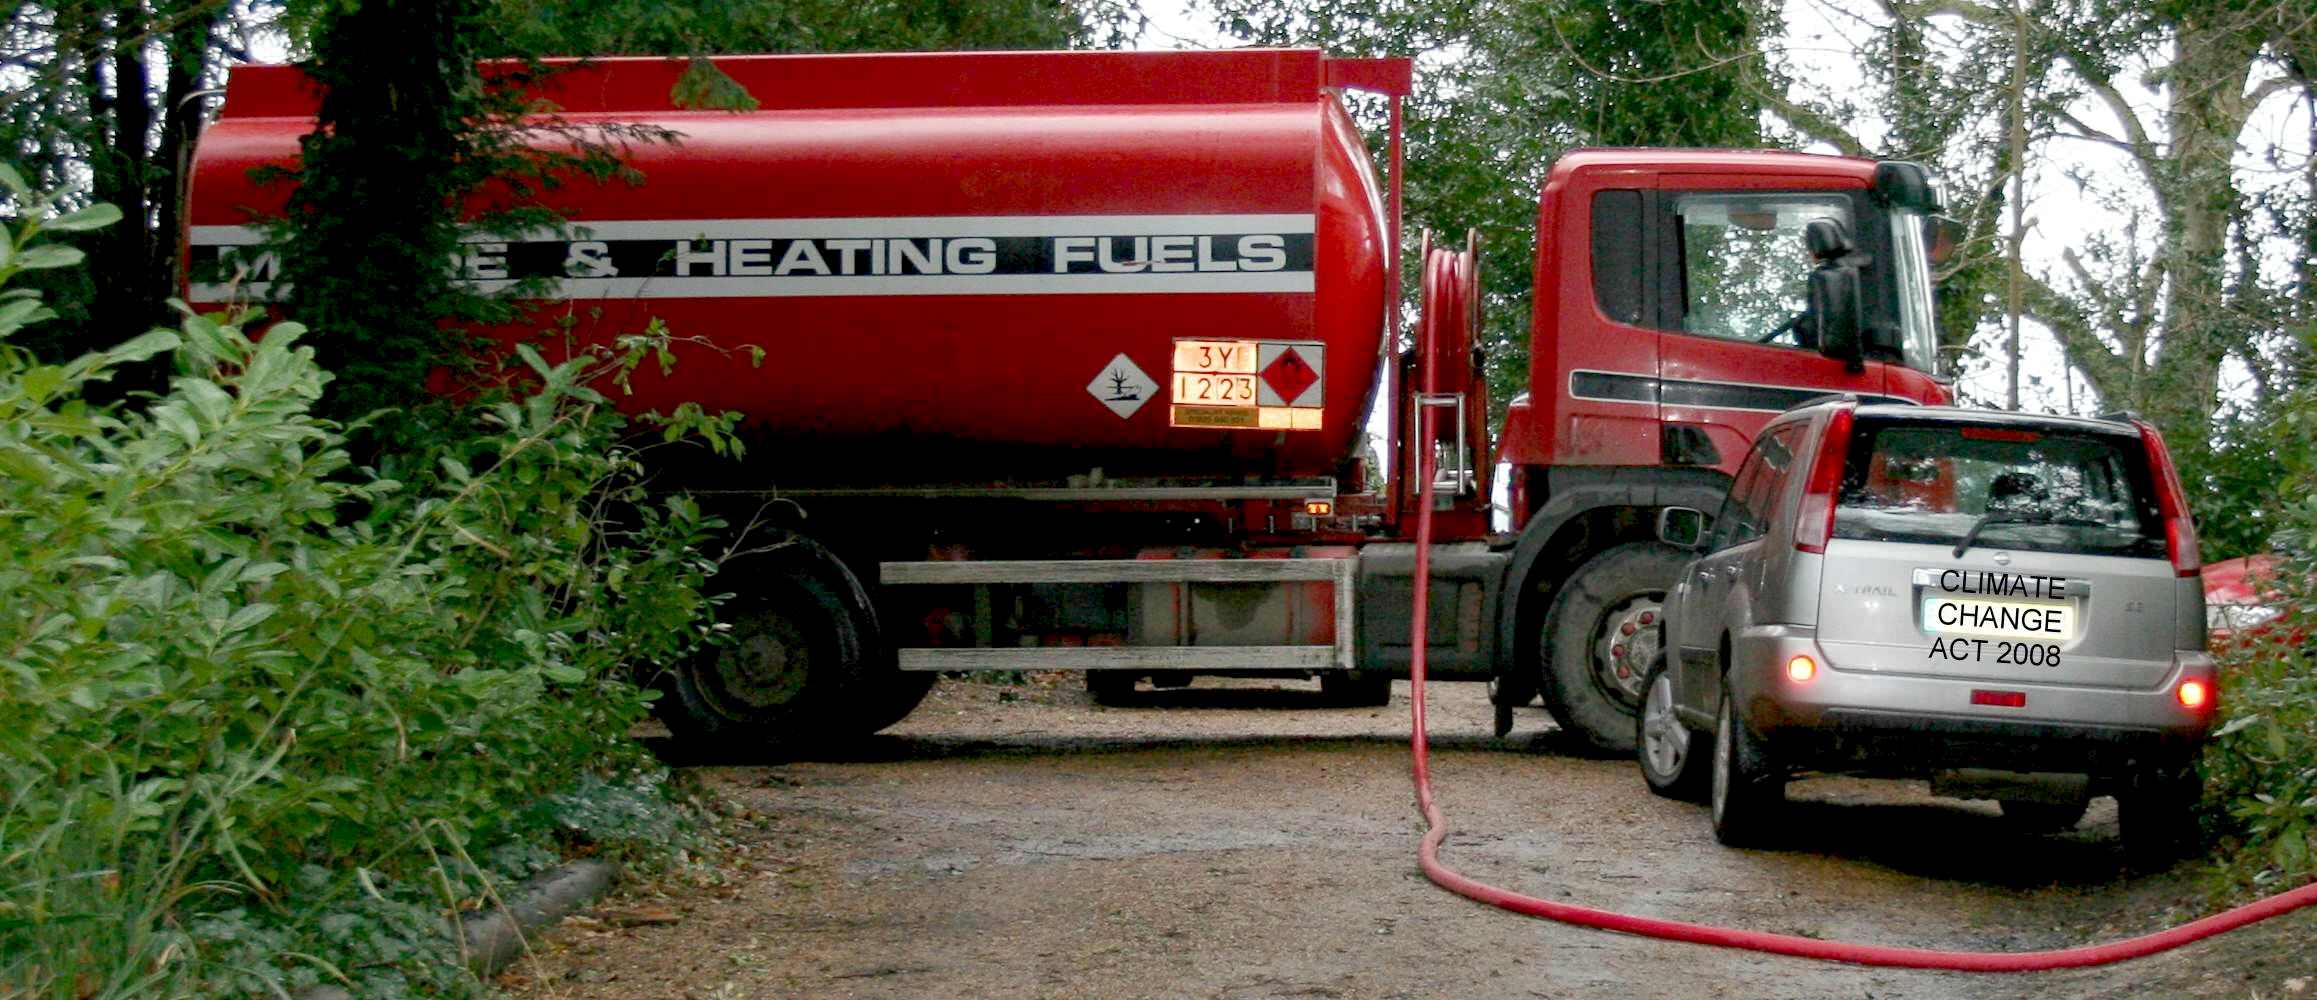
CARBON FOOTPRINTS - The proof is in the pudding. A snapshot taken of Lime Park in Sussex and surrounding areas in 2017 reveals that in the Wealden District, truckloads of oil is being burned to fuel climate chaos. At this rate we'll never meet our targets. We need to keep tabs on what Councils in the UK are not doing, rather than what they are doing and lobby local councillors and MPs for change.
INDUSTRIAL
GROWTH = MORE CARBON
For the purposes of the present discussion, let us assume that future per capita UK growth increases modestly at 1.3% per year. This level of growth would add another 440 Mt of carbon dioxide to the 2050 total, for a total of about 1200 Mt, ten times the 2050 target. And in 2022 this rate of growth would add about another 135 Mt of carbon dioxide emissions, for a total of 738 Mt, approaching twice the 2022 target.
EARTH
EVALUATION - The 13th European Evaluation Society (EES) Biennial Conference will be held from 1-5 October 2018 in Thessaloniki,Greece. The theme of the conference is "Evaluation for more resilient societies". The conference will hold debates on evaluation in times of financial, geopolitical, environmental and humanitarian crisis.
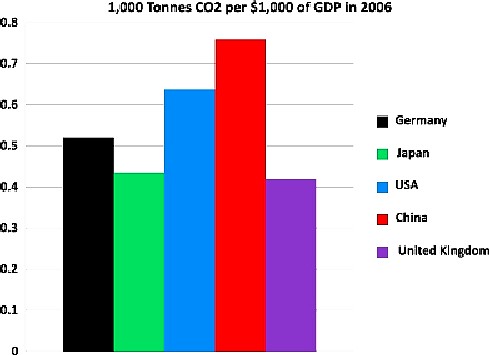
EVALUATION 2006 - Cross-national comparisons can provide some quantitative, practical sense of the magnitude of the challenge. Figure 4 shows tonnes of carbon dioxide per $1000 of GDP for the United States, China, Germany, Japan and the United Kingdom. Figure 4 shows that the United Kingdom, at 0.42 t of carbon dioxide per $1000 of GDP in 2006, was comparable to Japan in its emissions per unit GDP. The UK was more carbon efficient than Germany, and much more so than the United States and China.
EVAL
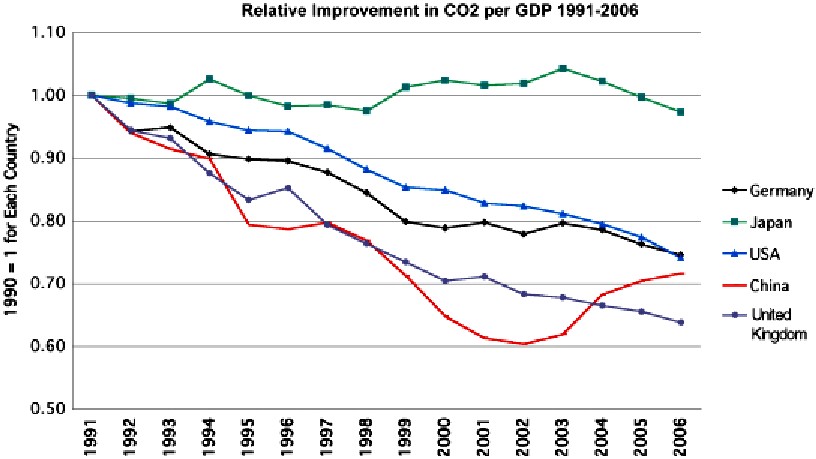
91-06 - The UK's rate of decarbonization has been much greater than that of Japan, which saw little change over the period, and faster than the United States or Germany, which have had similar rates of decarbonization. One important reason for the decarbonization of the UK's economy has been the large decrease in manufacturing as a portion of its economy, from 33% in 1970 to 13% in 2007 (Marsh 2009). China saw its rapid decarbonization reversed in the early years of the decade. Thus, there is no recent precedent among developed countries with large economies for the sustained rapid rates of decarbonization implied by the Climate Change Act. Such rates necessarily must be several times greater than observed in the UK in recent decades, and based on different contributors as the sectoral shift away from manufacturing has its limits.
The approach to emissions reduction embodied by the Climate Change Act is a backward one. It begins with setting a target and then retrospectively asking policy makers how that target might be achieved
There appears to be no guidance as to feasible rates of carbon rehabilitation for councils that are more used to emptying bins, sweeping roads, collecting taxes and enforcing against unauthorized development. This is bound to lead to some cold-turkey situations, where councils fail to recognize climate change projects and waste public money trying to prevent such efforts, where that expenditure is of course increasing their carbon footprints - hence is counterproductive.
The uncomfortable reality is that no one knows how fast a major economy can decarbonize. Both the 2022 interim and 2050 targets require rates of decarbonization far in excess of what has been observed in large economies at anytime in the past. Simply
makiivng progress to the targets requires steps of a magnitude that seem practically impossible, e.g., such as the need
for the UK to achieve a carbon efficiency of its economy equal to that of France in 2006 in a time period considerably less than a decade.
A UK climate policy recast in terms of accelerating decarbonization has the advantage for the UK to properly claim global leadership. Consider that if the world averaged 0.42 t of carbon dioxide per $1000 of GDP, as was the case in the UK in 2006, global emissions of carbon dioxide would have been about 10 000 Mt or 32% less than what actually occurred. This amount of reduction is almost 20 times the total emissions of the UK in 2006. Far more important than setting impossible national targets on timetables than cannot be met would be efforts to accelerate decarbonization in the UK to higher rates, while at the same time working internationally to assist other countries in meeting the challenge of decarbonization.
CLIMATE
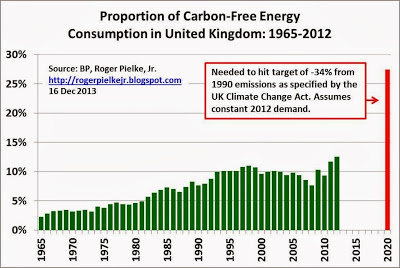
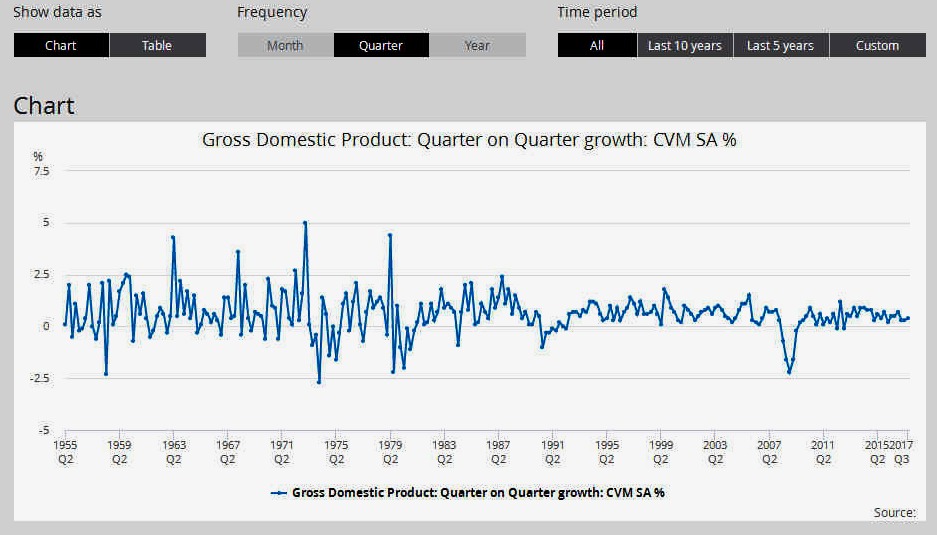
CHANGE ACT FAILURE 2014 - The Belgian think tank Bruegel points to data showing that the United Kingdom's GDP has returned to pre-economic crisis levels, as shown above. This allows us to do a quick and intuitive examination of how much the UK economy has decarbonized over that time period, and how that rate of decarbonization compares to that implied by the UK Climate Change Act.
YOICHI KAYA
The Kaya identity is an identity stating that the total emission level of the
greenhouse gas, carbon dioxide, can be expressed as the product of four factors:
human
population, GDP per capita, energy intensity (per unit of GDP), and
carbon intensity (emissions per unit of energy consumed).
UK OFFICE FOR NATIONAL STATISTICS - DOOMSDAY BOOK
Since its establishment, ONS has had five Directors: Professor Tim Holt; Len Cook; Karen Dunnell; Jil Matheson; and, from October 2012, Glen Watson. Len Cook was the first Director to hold the newly created role of National Statistician. The roles of Director of ONS and National Statistician were combined until 2012 when Jil Matheson continued as National Statistician while Glen Watson became Director of the ONS. John Pullinger replaced Jil Matheson as National Statistician (and Chief Executive of the UK Statistics Authority) in July 2014.
BIG BROTHER AWARD
The Office for National Statistics won the 2004 Big Brother Award for the "Most Heinous Government Organisation" from the campaigning organisation Privacy International for its Citizen Information Project. The project is one of several that lead the Information Commissioner to warn that there is a danger of the country "sleepwalking" into a surveillance society.
IOP PAPER 18-6-09 - This paper evaluates the United Kingdom's Climate Change Act of 2008 in terms of the implied rates of decarbonization of the UK economy for a short-term and a long-term target established in law. The paper uses the Kaya identity to structure the evaluation, employing both a bottom up approach (based on projections of future UK population, economic growth, and technology) and a top down approach (deriving implied rates of decarbonization consistent with the targets and various rates of projected economic growth).
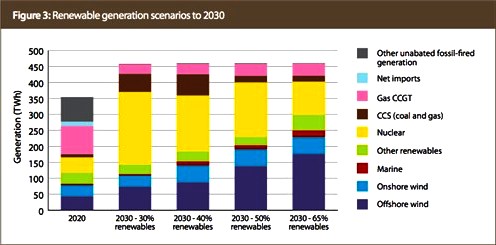
Both approaches indicate that the UK economy would have to achieve annual rates of decarbonization in excess of 4 or 5%. To place these numbers in context, the UK would have to achieve the 2006 carbon efficiency of France by about 2015, a level of effort comparable to the building of about 30 new nuclear power plants, displacing an equivalent amount of fossil energy. The paper argues that the magnitude of the task implied by the UK Climate Change Act strongly suggests that it is on course to fail, and discusses implications.
PINK BOOK SUMMARY PUBLISHED 30 OCT 2015
The deficit on the current account balance widened in 2014 to £92.9
billion. This deficit equated to 5.1% of gross domestic product (GDP) in current market prices. In both terms, this was the largest annual deficit since records began in 1948. -
The surplus in the trade in services balance widened by £8.1 billion, from £81.0 billion in 2013 to £89.1 billion in 2014.
CONTACTS
Office For National Statistics 1 Drummond Gate
Emma Howley
- National Accounts Coordination Division
Craig Taylor
- Balance of Payments
Office
For National Statistics
European Evaluation Society Secretariat
Tel.: (+420) 261 174 309
Earth Eval
LINKS & REFERENCE
http://iopscience.iop.org/ https://www.theguardian.com/uk/2006/apr/19/politics.idcards https://www.ons.gov.uk/ http://www.ees2018.eu/
Copyright © Cleaner Oceans Foundation Ltd (COFL) (Company No: 4674774) 2018. Ocean Suite, BN271RF, United Kingdom.
|